Portfolio
Tableau
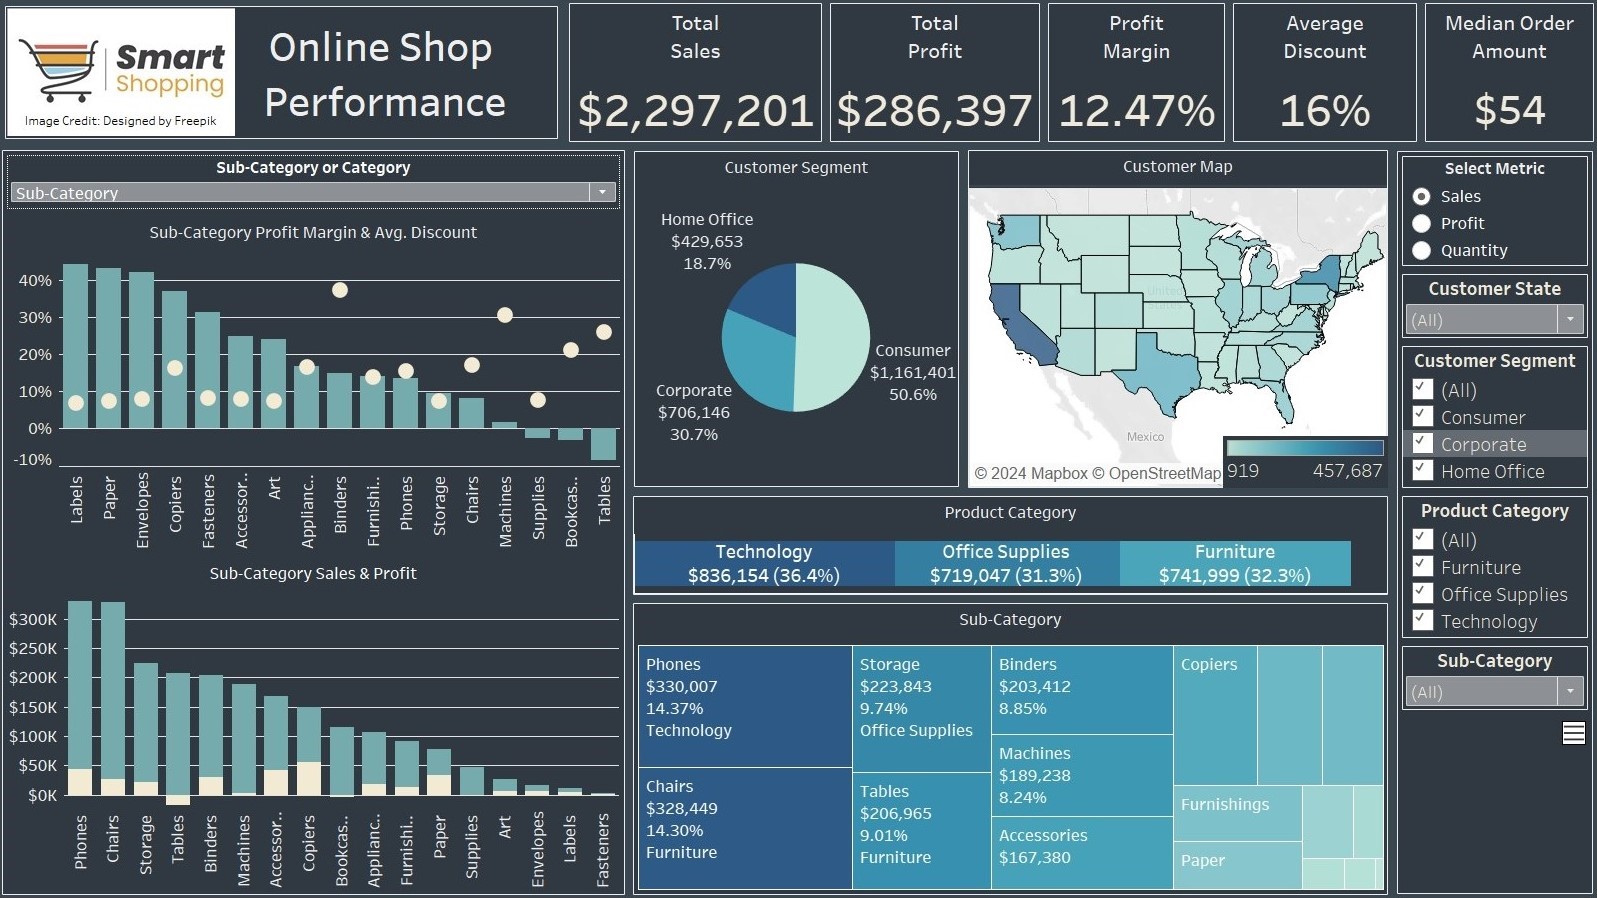
E-Commerce Insights: Driving Growth and Maximizing Profits
This dashboard highlights key performance indicators of an online shop that specializes in the sale of Technology, Office Supplies, and Furniture. On the top it features KPI's to for a quick assesment of the overall performance of selected filters. A dynamic zone is implemented on the left hand size which allows the user to switch from sub-category charts to category charts. The user is able to select between the following metrics Sales, Profit, Quantity which will affect the charts on the right-half of the dashboard. Some key findings include the shops Furniture category is hardly profitable with a Profit Margin of 2.49%. Meanwhile the Technology category makes up 50.8% of the Total Profit while accouting for only 18.3% of all the products sold. This online shop should shift focus away from Furniture and towards Technology to maximize profits. All are welcome to explore the dashboard and provide feedback.
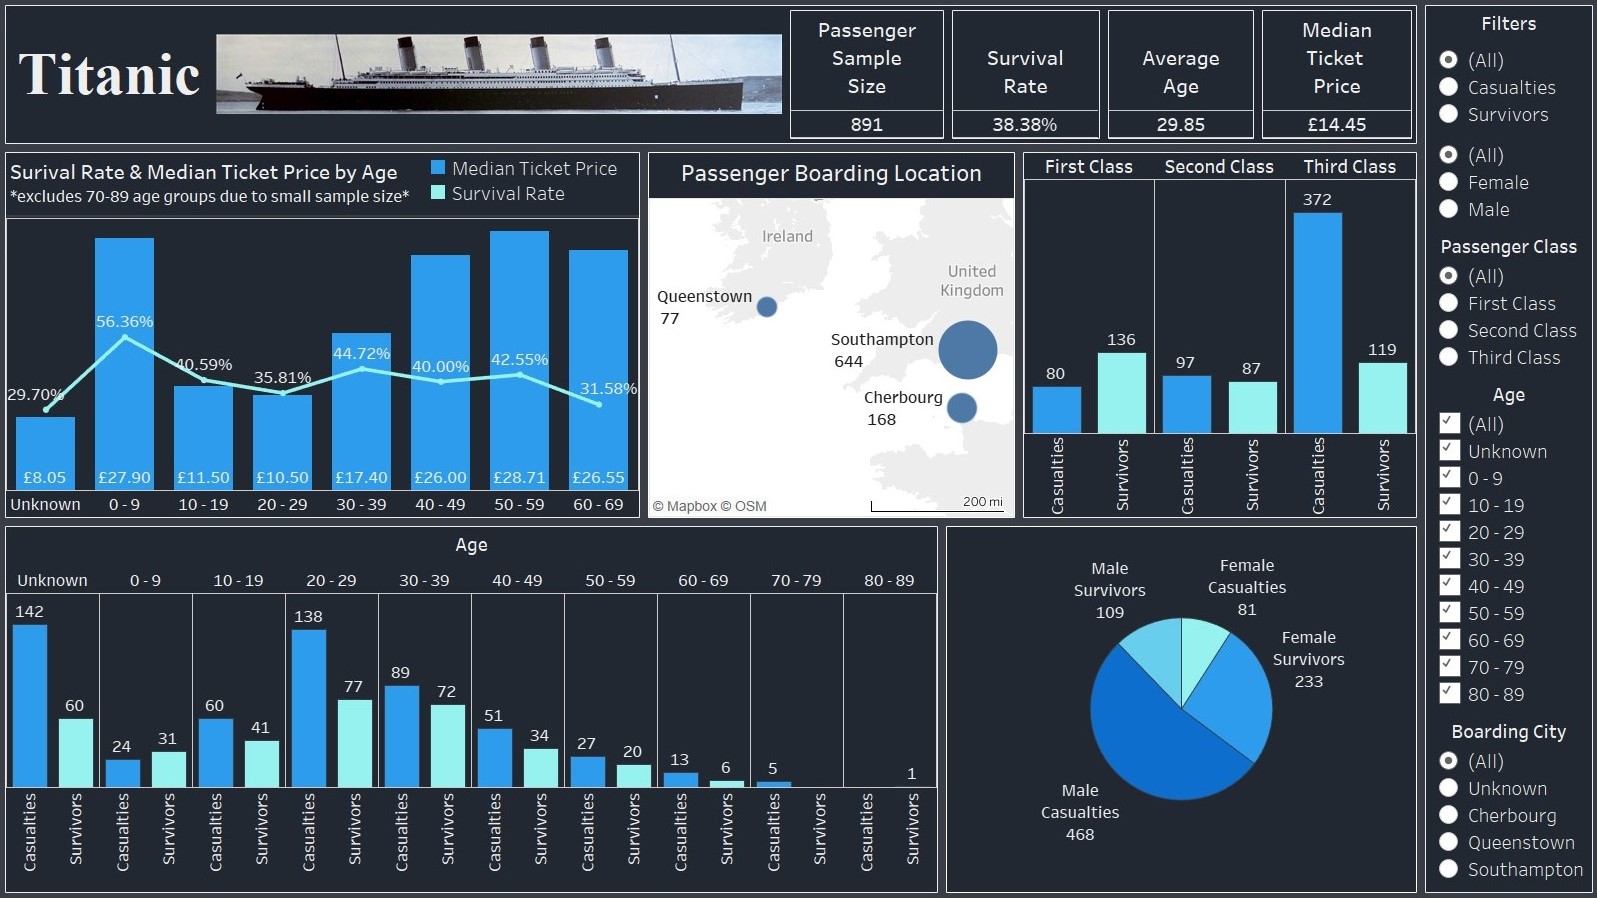
Titanic Insights: Unveiling Demographics, Survival Rates, and Boarding Locations
Dashboard provides insights about the survivors and casualties onboard the Titanic's maiden voyage in 1912. The data is composed of 891 passengers out of the 2,240 onboard the Titanic. A few key indicators of survivability derived from the dashboard appear to be if you were a female, a first class passenger, or in the 0-9 year old range group. I welcome all to explore the Titanic dashboard and make their own findings in this passenger data sample.
MySQL & Tableau
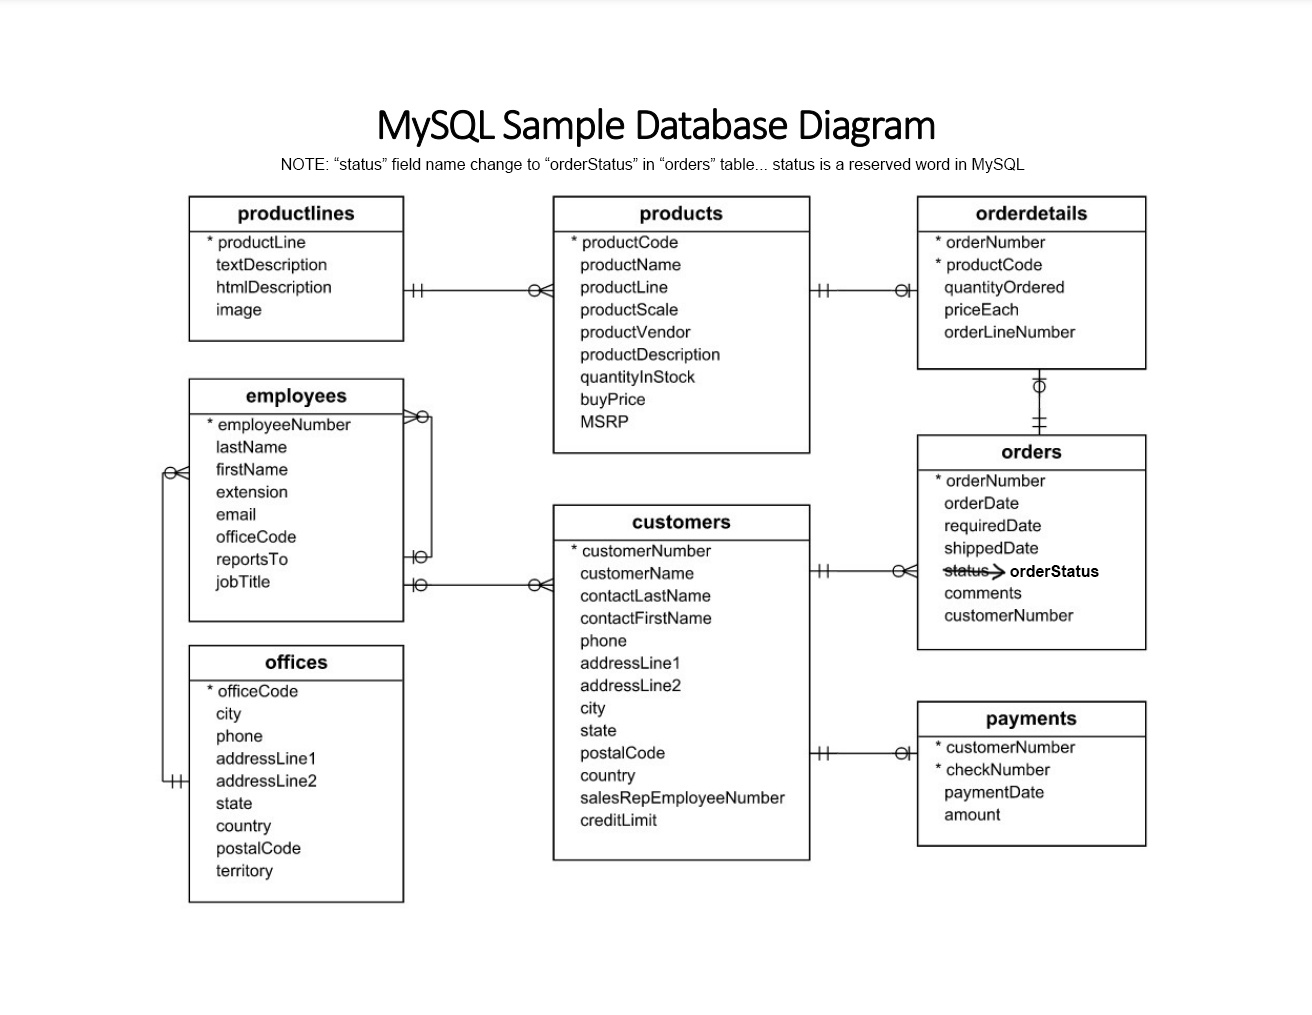
Classic Models Database (GitHub)
Annual Product Sales by Country (Tableau Dashboard) + (MySQL Code) + (Revised Data)
Top 10 Products Forecast (Tableau Dashboard) + (MySQL Code)
All-Time Product Rankings (Tableau Dashboard) + (MySQL Code)
Annual Product Lines Performance (Tableau Dashboard) + (MySQL Code)
Stored Procedures (MySQL Code)
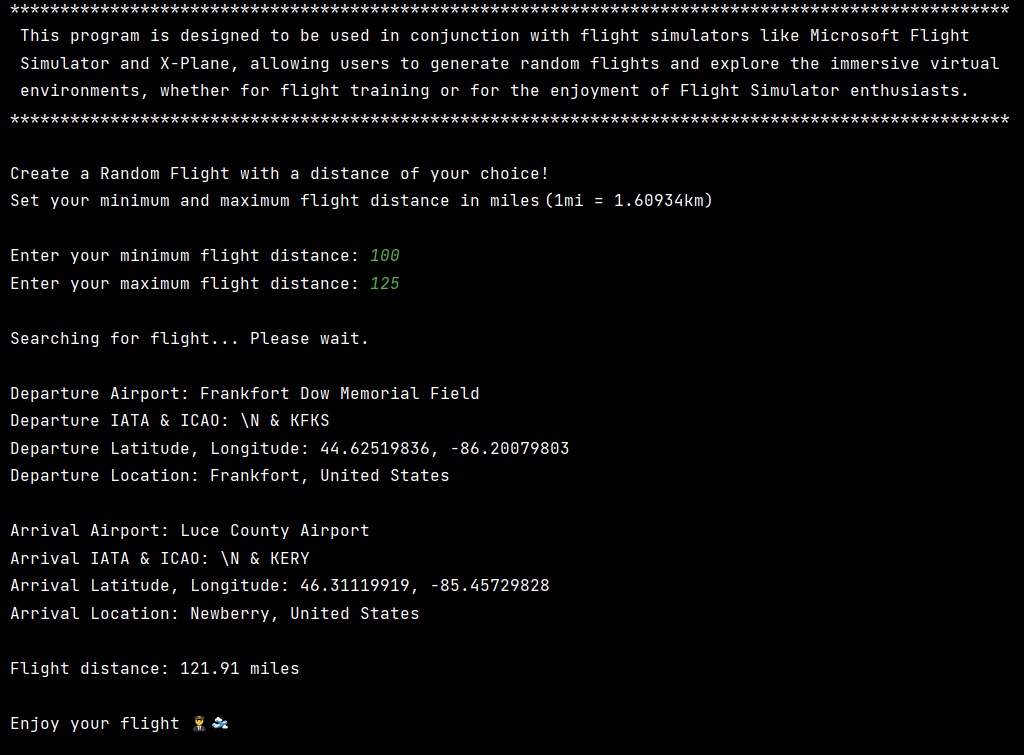
Python.
PLEASE NOTE: Patiently wait for programs to load on Replit it may take a minute.
VIEW CODE: Press button with two brackets <> on the top-right of Replit website.
